PL-300 Online Practice Questions and Answers
Note: This question is part of a series of questions that present the same scenario. Each question in the series contains a unique solution that might meet the stated goals. Some question sets might have more than one correct solution, while
others might not have a correct solution.
After you answer a question in this scenario, you will NOT be able to return to it. As a result, these questions will not appear in the review screen.
You have a clustered bar chart that contains a measure named Salary as the value and a field named Employee as the axis. Salary is present in the data as numerical amount representing US dollars.
You need to create a reference line to show which employees are above the median salary.
Solution: You create a percentile line by using the Salary measure and set the percentile to 50%.
Does this meet the goal?
A. Yes
B. No
You have a Power Bl workspace that contains a dataset. a report, and a dashboard. The following groups have access:
1.
External users can access the dashboard.
2.
Managers can access the dashboard and a manager-specific report.
3.
Employees can access the dashboard and a row-level security (RLS) constrained report.
You need all users, including the external users, to be able to tag workspace administrators if they identify an issue with the dashboard. The solution must ensure that other users see the issues that were raised.
What should you use?
A. subscriptions
B. comments
C. alerts
D. chat in Microsoft Teams
You open a query in Power Query Editor.
You need to identify the percentage of empty values in each column as quickly as possible.
Which Data Preview option should you select?
A. Show whitespace
B. Column profile
C. Column distribution
D. Column quality
You have sales data in a star schema that contains four tables named Sales, Customer, Date, and Product. The Sales table contains purchase and ship dates.
Most often, you will use the purchase date to analyze the data, but you will analyze the data by both dates independently and together.
You need to design an imported dataset to support the analysis. The solution must minimize the model size and the number of queries against the data source.
Which data modeling design should you use?
A. Use the Auto Date/Time functionality in Microsoft Power Bl and do NOT import the Date table.
B. Duplicate the Date query in Power Query and create active relationships between Sales and both Date tables in the modeling view.
C. On the Date table, use a reference query in Power Query and create active relationships between Sales and both Date tables in the modeling view.
D. Import the Date table twice in Power Query and create active relationships between Sales and both Date tables in the modeling view.
Note: This question is part of a series of questions that present the same scenario. Each question in the series contains a unique solution that might meet the stated goals. Some question sets might have more than one correct solution, while
others might not have a correct solution.
After you answer a question in this section, you will NOT be able to return to it. As a result, these questions will not appear in the review screen.
You have a Microsoft Excel workbook that is saved to Microsoft SharePoint Online. The workbook contains several Power View sheets.
You need to recreate the Power View sheets as reports in the Power Bl service.
Solution: From the Power Bl service, get the data from SharePoint Online, and then click Connect
Does this meet the goal?
A. Yes
B. No
Note: This question is part of a series of questions that present the same scenario. Each question in the series contains a unique solution that might meet the stated goals. Some question sets might have more than one correct solution, while
others might not have a correct solution.
After you answer a question in this section, you will NOT be able to return to it. As a result, these questions will not appear in the review screen.
From Power Query Editor, you profile the data shown in the following exhibit.
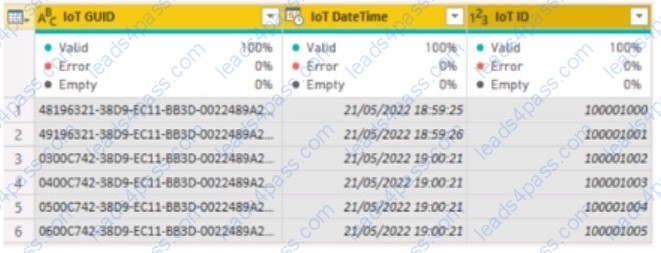
The IoT GUID and IoT ID columns are unique to each row in query.
You need to analyze IoT events by the hour and day of the year. The solution must improve dataset performance.
Solution: You remove the loT GUID column and retain the loT ID column.
Does this meet the goal?
A. Yes
B. No
Remove unused columns from tables in the data model. This will reduce the size of your PBIX file and make your data model more efficient. You can use Power Query Editor to remove any columns that are not used in your report or calculations.
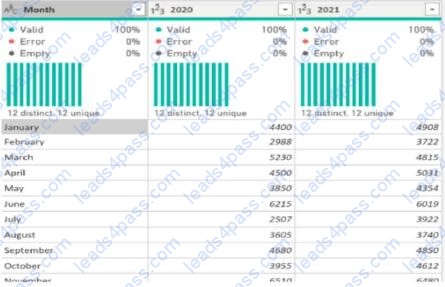
You need to shape the query to display the following three columns:
1.
Month
2.
Sales
3.
Year
What should you select in Power Query Editor?
A. Pivot column
B. Merge columns
C. Unpivot columns
D. Transpose
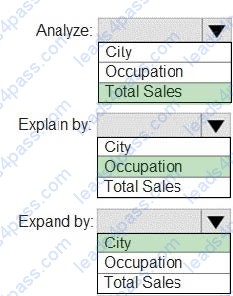
HOTSPOT
You have a table that contains the following three columns:
1.
City
2.
Total Sales
3.
Occupation
You need to create a key influencers visualization as shown in the exhibit. (Click the Exhibit tab.)
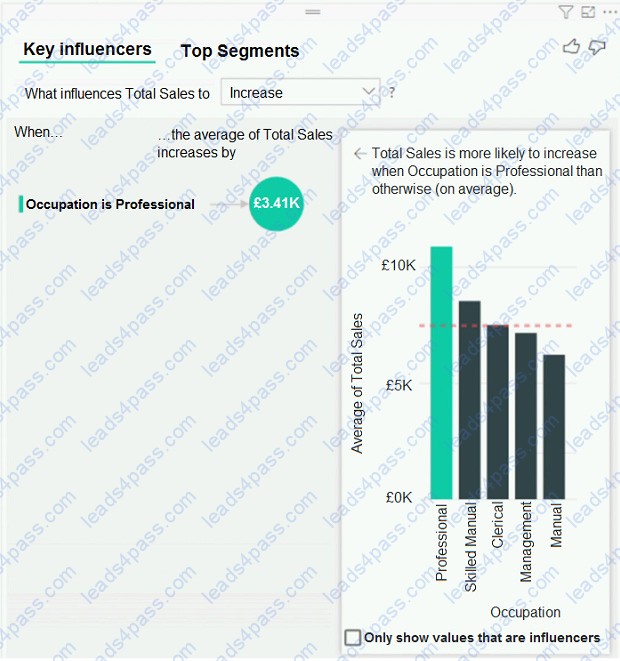
How should you configure the visualization? To answer, select the appropriate options in the answer area.
NOTE: Each correct selection is worth one point.
Hot Area:
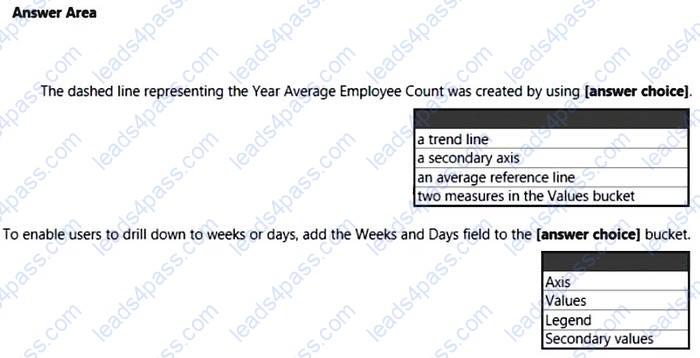
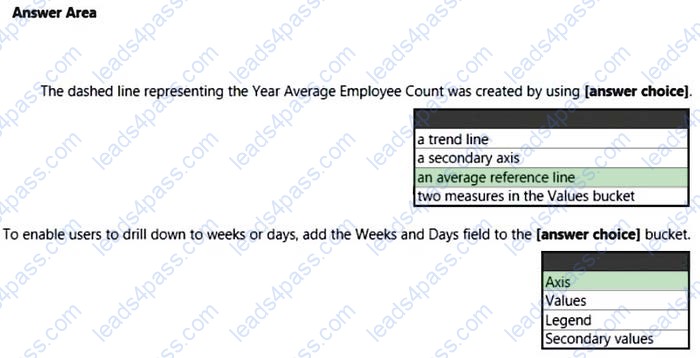
HOTSPOT
You are creating a line chart in a Power Bl report as shown in the following exhibit.
Use the drop-down menus to select the answer choice that completes each statement based on the information presented in the graphic.
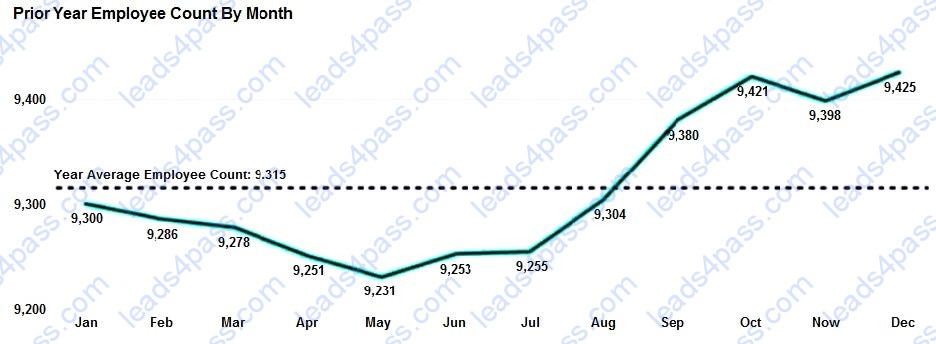
NOTE: Each correct selection is worth one point.
Hot Area:
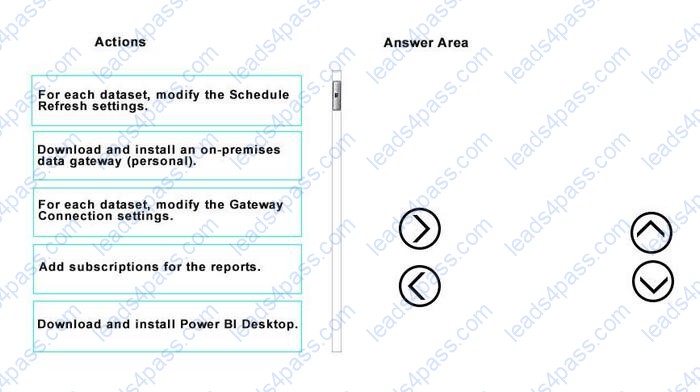
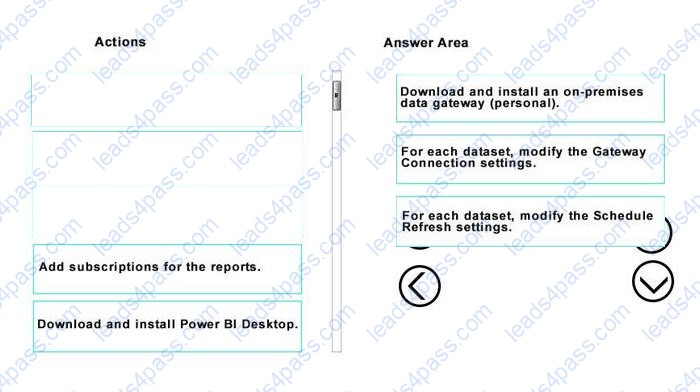
DRAG DROP
You have a Microsoft Excel workbook that contains two tables.
From Power BI, you create a dashboard that displays data from the tables.
You update the tables each day.
You need to ensure that the virtualizations in the dashboard are updated daily.
Which three actions should you perform in sequence? To answer, move the appropriate actions from the list of actions to answer area and arrange them in the correct order.
Select and Place:
![]()
![]()
![]()
![]()
![]()
![]()
All rights are reserved by
leads4pass.com. Any changes, copy or trademarks abuse will be
regarded as infringement.
leads4pass.com will reserve the right to pursue accountability.
Copyright © 2004-
2026 leads4pass.com.