ICBB Online Practice Questions and Answers
Which statement(s) are correct about the Pareto Chart shown here for the DOE analysis? (Note: There are 2 correct answers).
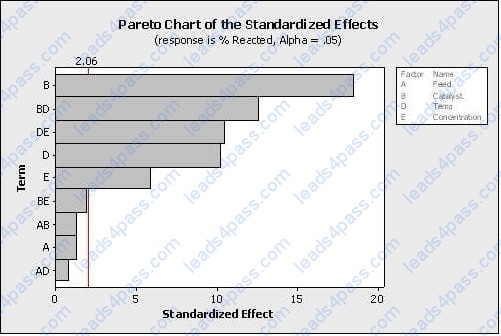
A. It is unknown from this graph how many factors were in the Experimental Design
B. The factors to keep in the mathematical model are E, D, DE, BD and B with an alpha risk equal to 2.06
C. The effects to keep in the mathematical model are E, D, DE, BD and B with an alpha risk equal to 0.05
D. The factors to keep in the mathematical model with a 5% alpha risk are BE, AB, A and AD
A. Are downtime issues easily noted?
B. Can extra inventory be seen easily?
C. Are unneeded tools or supplies easily noted?
D. Are setups optimized for lower scrap levels?
Which statement(s) are correct about the Regression shown here? (Note: There are 2 correct answers).
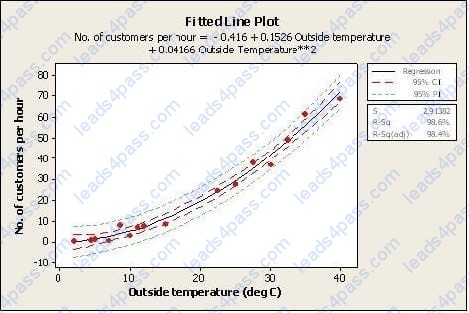
A. The dependent variable is the outside temperature
B. The relationship between outside temperature and number of customers per hour is a Linear Regression
C. The dashed lines indicate with 95% confidence where all of the process data should fall between
D. The dashed lines indicate with 95% confidence the estimate for the Quadratic Regression Line
E. The predicted number of customers per hour is close to 5 if the outside temperature is 10 deg C
A(n) ______________ is best used to compare a Machine 1 average quality characteristic to the same quality characteristic of Machine 2.
A. F test
B. 1-Sample t-test
C. 2-Sample t-test
D. ANOVA test
If in an experiment all possible variable pairs sum to zero the design is Orthogonal.
A. True
B. False
For the data shown here which statement(s) are true? (Note: There are 2 correct answers).
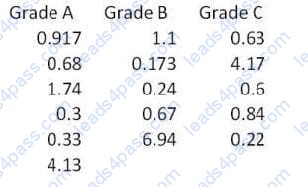
A. With 95% confidence, we cannot conclude if the samples are from three Normal Distributions
B. With greater than 95% confidence, we conclude the samples are from Non-normal Distributions
C. If we wanted to compare the Central Tendencies of these three samples we would use the one way ANOVA test
D. If we wanted to compare the Central Tendencies of these three samples we could use Mood's Median test
E. If we wanted to compare the Central Tendencies of all three samples we could use the Mann- Whitney test
The Central Limit Theorem says that as the sample size becomes large the sample Mean distribution will form a Normal Distribution, ____________________.
A. If the Measurement System is properly calibrated
B. When the data is collected accurately
C. If the shape is evenly spread
D. No matter what the shape of the population distribution of individuals
Identify the indicated area in the House of Quality from the following list.
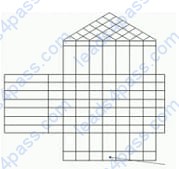
A. Relationships
B. Technical importance
C. Competence criteria
D. Customer importance
Which of the following is categorized as strength?
A. High cost structure
B. Unfulfilled customer needs
C. New regulations
D. Resources and capabilities
![]()
![]()
![]()
![]()
![]()
![]()
All rights are reserved by
leads4pass.com. Any changes, copy or trademarks abuse will be
regarded as infringement.
leads4pass.com will reserve the right to pursue accountability.
Copyright © 2004-
2026 leads4pass.com.