
E20-026 Online Practice Questions and Answers
What is an example of a null hypothesis?
A. that a newly created model does not provide better predictions than the currently existing model
B. that a newly created model provides a prediction of a null sample mean
C. that a newly created model provides a prediction of a null population mean
D. that a newly created model provides a prediction that will be well fit to the null distribution
You have used k-means clustering to classify behavior of 100, 000 customers for a retail store. You decide to use household income, age, gender and yearly purchase amount as measures. You have chosen to use 8 clusters and notice that 2 clusters only have 3 customers assigned. What should you do?
A. Decrease the number of clusters
B. Increase the number of clusters
C. Decrease the number of measures used
D. Identify additional measures to add to the analysis
A data scientist wants to predict the probability of death from heart disease based on three risk factors: age, gender, and blood cholesterol level.
What is the most appropriate method for this project?
A. Logistic regression
B. Linear regression
C. K-means clustering
D. Apriori algorithm
In a Student's t-test, what is the meaning of the p-value?
A. it is the area under the appropriate tails of the Student's distribution
B. it is the "power" of the Student's t-test
C. it is the mean of the distribution for the null hypothesis
D. it is the mean of the distribution for the alternate hypothesis
In linear regression modeling, which action can be taken to improve the linearity of the relationship between the dependent and independent variables?
A. Apply a transformation to a variable
B. Use a different statistical package
C. Calculate the R-Squared value
D. Change the units of measurement on the independent variable
In the MapReduce framework, what is the purpose of the Reduce function?
A. It aggregates the results of the Map function and generates processed output
B. It distributes the input to multiple nodes for processing
C. It writes the output of the Map function to storage
D. It breaks the input into smaller components and distributes to other nodes in the cluster 26 / 55
Refer to the exhibit.
In the exhibit, a correlogram is provided based on an autocorrelation analysis of a sample dataset.
What can you conclude from only this exhibit?
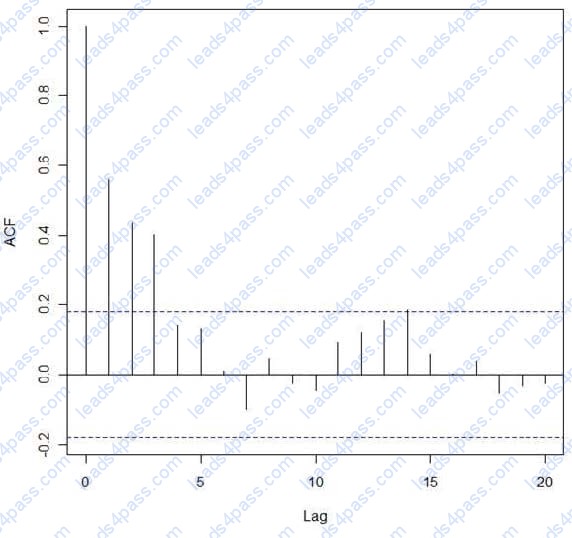
A. There is significant autocorrelation through lag 3
B. There is no structure left to model in the data
C. Lag 7 has a significant negative autocorrelation
D. Differencing is required before proceeding with any analysis
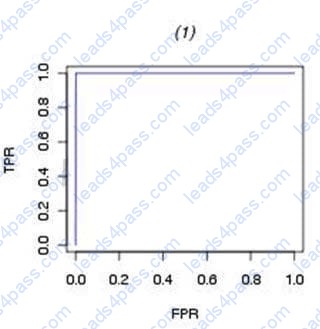
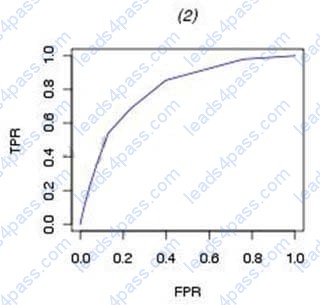
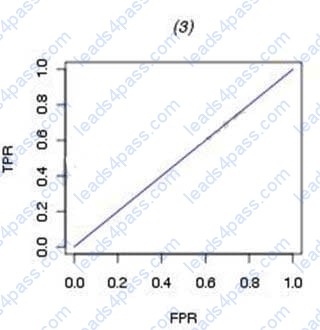
Which ROC curve represents a perfect model fit? A)
B)
C) 52 / 55
D)
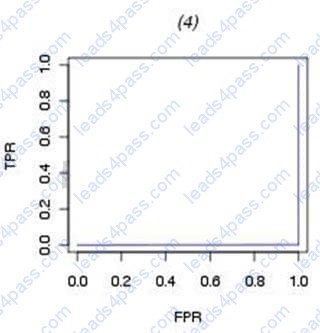
A. Exhibit A
B. Exhibit B
C. Exhibit C
D. Exhibit D
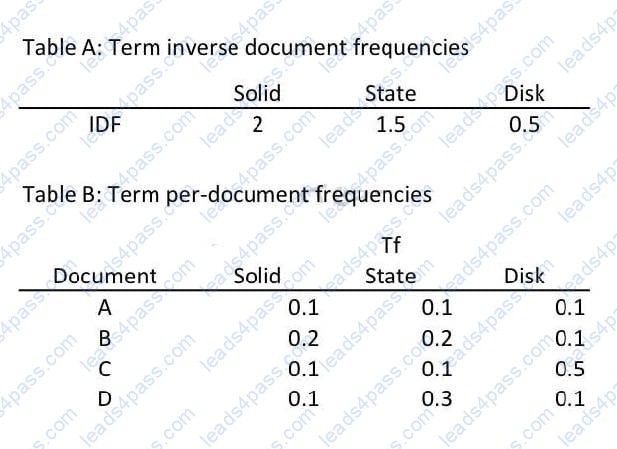
Refer to the exhibit. Click on the calculator icon in the upper left corner. An analyst is searching a corpus of documents for the topic "solid state disk". In the Exhibit, Table A provides the inverse document frequency for each term across the corpus. Table B provides each term's frequency in four documents selected from corpus. Which of the four documents is most relevant to the analyst's search?
A. Document B
B. Document A
C. Document C
D. Document D





All rights are reserved by
leads4pass.com. Any changes, copy or trademarks abuse will be
regarded as infringement.
leads4pass.com will reserve the right to pursue accountability.
Copyright © 2004-
2026 leads4pass.com.