CSSBB Online Practice Questions and Answers
Which item(s) listed would impact the Process Capability for a process with a continuous output? (Note: There are 4 correct answers).
A. Shape of process data distribution (e.g. Normal Distribution)
B. Process Technology
C. Process Standard Deviation
D. Presence of Special Causes or solely Common Causes
E. Seasonal variation in process
On a _________________ one can see a pattern from the graphed points such that conclusions can be drawn about the largest family of Variation.
A. Multi-Vari Chart
B. Weighted Scale
C. X-Y Matrix
D. Poisson Chart
A valuable tool to use during the Measure Phase to show material and information flow throughout an entire process is the ______________ .
A. Value Stream Map
B. FMEA
C. Pareto Chart
D. Standard Operating Procedure
If a Belt needed to model the data for the number of weaves in section of carpet fabric she would use the _____________ Distribution approach.
A. Poisson
B. Extended
C. Exponential
D. Weibull
Much of the Six Sigma methodology is used to identify and remove causes for _____________ .
A. Process Variation
B. Material Costs
C. Excess Inventory
D. Lost Sales
Some of the sources for different types of error that can be quantified using Statistical Analysis are ___________________.
A. Error in sampling
B. Bias in sampling
C. Error in measurement
D. All of these answers are correct
From the variance F-test shown above, which of these conclusions is/are valid?
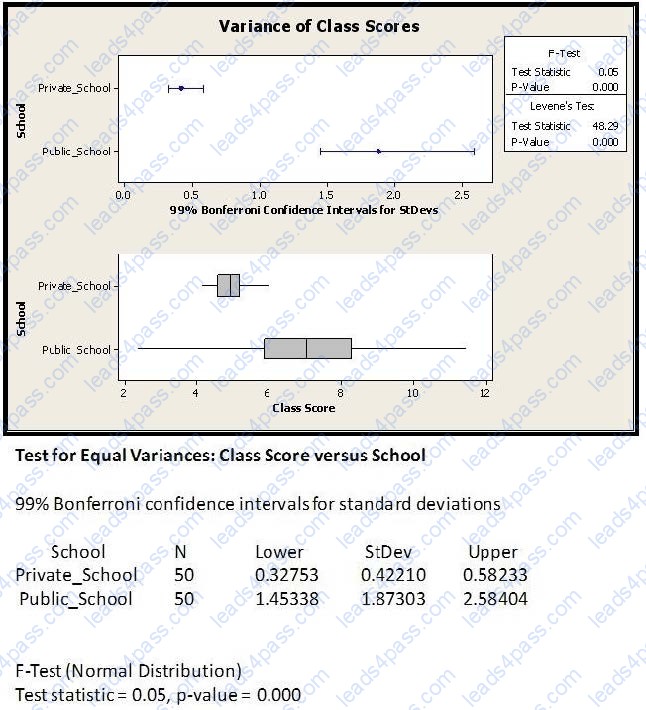
A. The variance between the class score distribution is not significantly different
B. This test applies only to Normal Distributed data at 99 % confidence
C. The variance between the class score distribution is significantly different
D. There are not enough data points to make any statistical conclusions
The validity of the decision made with Hypothesis Testing is dependent upon all of these except ___________________.
A. Beta risk
B. Alpha risk
C. Range of data
D. Sample size
How many experimental runs exist in a Full Factorial and fully randomized design for 5 factors with 2 replicates for the Corner Points and no Center Points? The factors in the experiment are only at 2-levels.
A. 10
B. 128
C. 256
D. 64
It would be more likely than not for a Belt conducting a Regression Analysis to find that the _______________________.
A. r2 value is smaller than the absolute value of r
B. Correlation Coefficient equals r2
C. Coefficient of Determination is less than r2
D. Correlation Coefficient equals r divided by 2
![]()
![]()
![]()
![]()
![]()
![]()
All rights are reserved by
leads4pass.com. Any changes, copy or trademarks abuse will be
regarded as infringement.
leads4pass.com will reserve the right to pursue accountability.
Copyright © 2004-
2026 leads4pass.com.